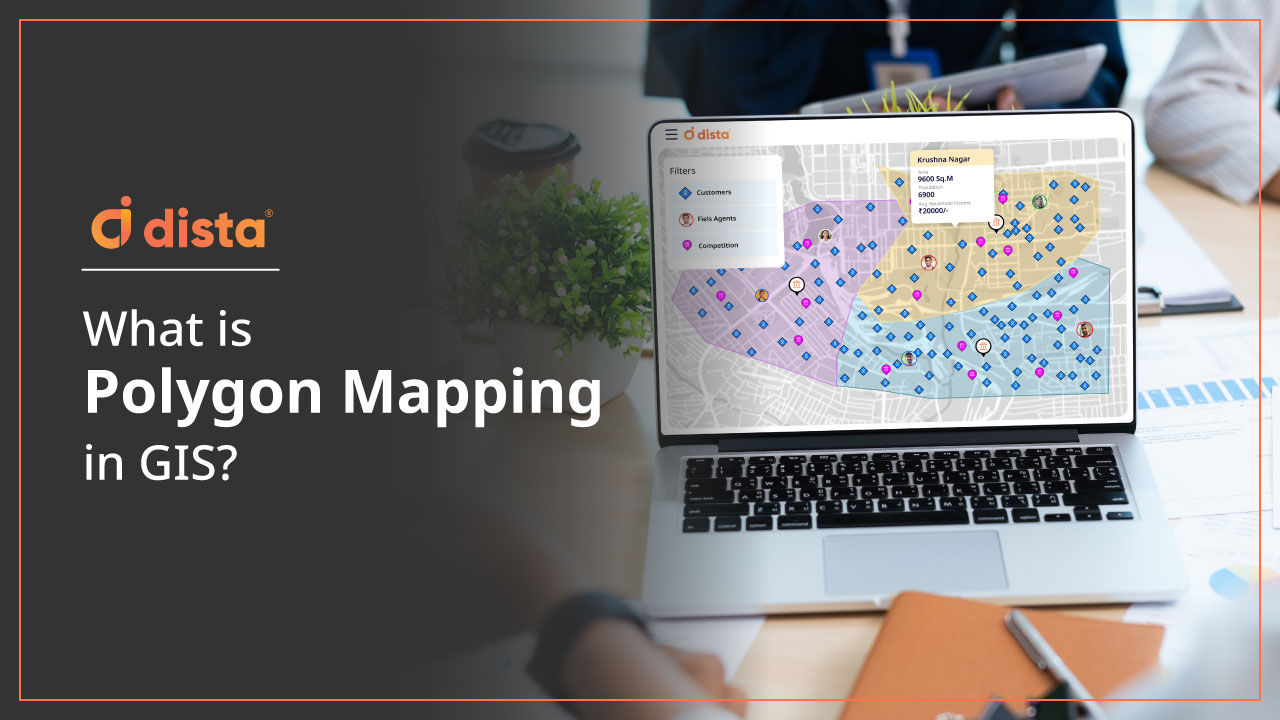
In Geographical Information Systems (GIS), vector data represents the information in three formats – points, lines, and polygons. Polygon mapping in GIS refers to the process of visualizing and analyzing geographic areas using polygons. They define boundaries for cities, districts, forests, and water bodies. Each polygon carries spatial and attribute data, allowing GIS users to analyze relationships, patterns, and distributions.
How to Create and Analyze Data Points With Polygons?
You can add multiple polygons to a layer; each polygon can consist of a different set of business rules. A layer consists of a large data set with different parameters like latitude, longitude, address, images, etc. You can manually create and edit polygons.
Moreover, you can freeze the most appropriate cluster into polygons. This way, you can superimpose multiple clusters and polygons for deeper data set analysis. Polygons are styled by count, color, density, etc. Clicking on them surfaces detailed information about its data, which can be downloaded.
Polygon Mapping with Dista Insight
Dista Insight, our AI-powered geospatial analytics software, uses location intelligence to visualize, strategize, and operationalize location data.
With Dista Insight, businesses can:
- Create and view polygons based on clustering rules
- Create polygons based on the outer points of the cluster
- Define, color, and name the polygons
- Configure data and view information for a polygon
- Create a grid for a location by defining the size of the cell
- Modify polygons and their attributes based on the superimposed grid view
- Save and share the analysis
Polygon Mapping Use Cases by Industry
1. NBFC and Microfinance
Sales and collection leaders of NBFCs and microfinance firms get meaningful insights from each polygon. Territory clusters of each polygon are defined using multiple parameters, including precise customer locations, customer density, base location of field agents, and more.
Accurate mapping of customers enables better collection coverage, increases the number of customer meetings held by field agents in a day, and reduces travel time and distance for field agents.
2. FMCG & Retail
Polygon mapping is crucial for sales territory mapping in consumer goods organizations. Sales and strategy leaders can design territories using multiple variables and run simulations to identify the most optimal territory mapping approach.
Strategic leaders design polygon clusters to balance territories with equitable lead distribution. They can run scheduling algorithms to schedule meetings and plan optimized routes, ensuring sales reps spend more time with prospects and customers.
For the CPG industry, polygon mapping offers a strategic advantage in understanding their retail outlet coverage. They can plan a cohesive growth strategy by planning business expansion and identifying underserved areas within and outside a polygon. They can also reduce resources in a particular polygon if they are being underutilized.
By identifying locations within polygon clusters suitable for opening a new store and overlaying competition data, companies can compare retail outlet coverage with competition, expanding their sales coverage.
3. Insurance
Using Disa’s patented clustering algorithm, insurance underwriters and claims managers can design polygons that accurately map insurers and improve policy conditions. Underwriters can use location-driven insights to identify area clusters that are high crime zones and prone to natural disasters to mitigate any risk of fraudulent claims.
Polygon mapping also ensures that an optimal number of field agents are aligned to every territory cluster. It helps in spotting gaps in agent assignment and resource optimization. Leaders gain full visibility of field agent activity on a map within every polygon.
4. Real Estate
Commercial and residential real estate companies can use polygon mapping to carve out areas based on the characteristics of area clusters. These characteristics could include the area’s socio-economic nature, mobility index, working population share, buying pattern, etc. Leaders can design polygons by segmenting every city into pincode-based clusters using these variables to unlock hotspots for new site selection.
Final Thoughts
Polygon mapping is crucial to get accurate visual insights into various variables. It helps establish relationships between critical spatial data points. Mapping polygons helps gain a detailed analysis of sales territories and consumer behavior patterns within an area cluster. It ensures that the mapping of reps, sales, and service visits are attributed accurately to the right place.
Dista Insight designs precise polygons to create optimized area clusters correlating multiple data variables to derive specific trends. Get in touch with us to see our geospatial analytics platform in action.