By 2025, the worldwide food and grocery delivery market is expected to rise to $72.3 billion, according to Statista. Meanwhile, the Indian quick commerce companies are expected to reach $5 billion in revenue by the end of 2025. Major players like Zepto, Swiggy Instamart, Blinkit (Groffers), Zomato, Big basket, and Dunzo, collectively raised $1.9 billion in the first six months of 2022, aiming for market capture.
Quick commerce players have started delivering groceries in 10 to 20 minutes from the dark stores. Understanding how to optimize delivery operations will be critical to ensure profitability as they expand their operations and get into less densely populated areas.
What Is a Dark Store?
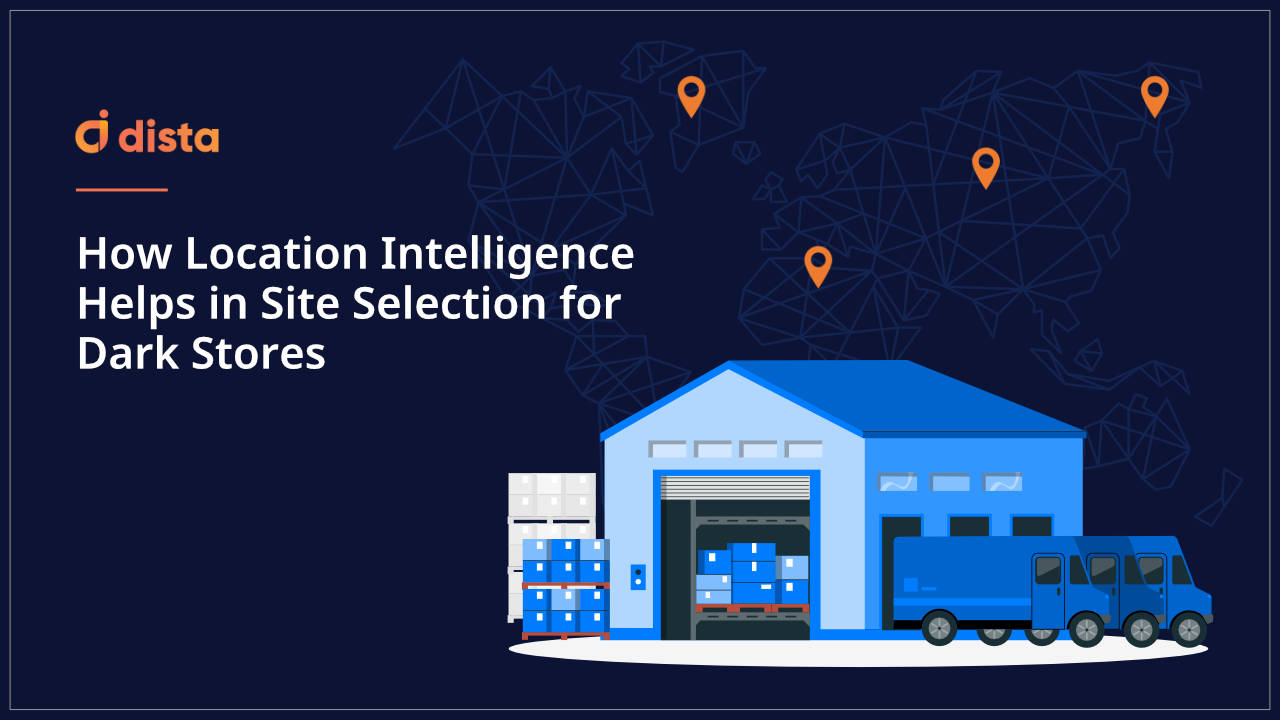
A dark store (ghost store) is a store used as a fulfillment center for delivery. They are not listed as a point of interest on any public-facing website or map platforms. Moreover, they are not open for pickups and in-store shopping. Dark stores are like micro warehouses strategically located to fulfill incoming orders on time.
The word, dark store was first heard in 2009 when Tesco in the UK started opening fulfillment centers to process over 4,50,000 orders from their existing retail stores. As the online delivery business grew, the use of dark stores increased. In fact, during the pandemic, a new business model highlighted dark stores as a service, where businesses started sharing dark stores between multiple companies to reduce operational and running costs.
How Location Intelligence Helps Businesses In Site Selection For Dark Stores
We know dark stores are essential for quick commerce companies, but how do businesses create foolproof dark store strategies to meet the demand? Although dark stores increase dynamic customer engagement and demand, they can also introduce new complexities.
Ample amount of research is required before opening a dark store, and 80% of the data points required for the study is location data. Research specific to customer data, demographics, socio-economic, purchasing power, consumer behavior, trade zone (how far you can serve from your dark store), etc., is vital for launching a dark store.
Businesses need a powerful location intelligence platform to take informed decisions and help solve the million-dollar question. Dista, an AI-enabled location intelligence platform, helps enterprises solve location problem statements. The team at Dista believes in democratizing location intelligence not just for tech organizations but for any organization with location at its heart.
Let's Understand this with an Example:
The more complex job is on the field, searching for ideal locations to open dark stores for a grocery business. In this scenario, the Growth team has been given eight locations by their Field team as potential areas. The challenge is to find out five locations that will provide maximum coverage and fit the business needs.
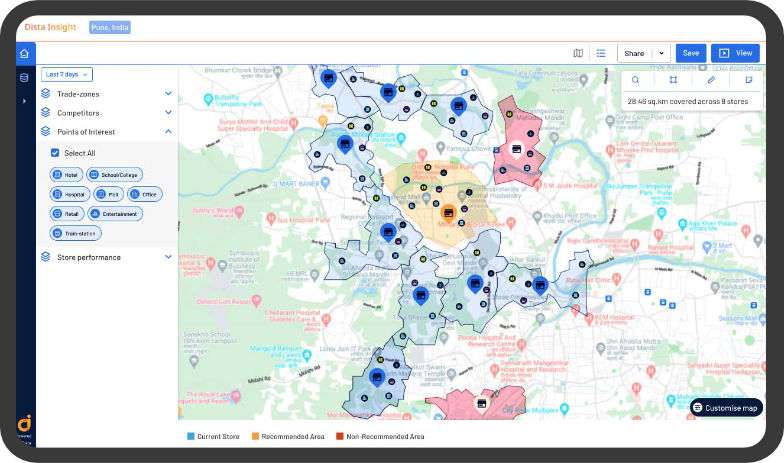
The next step is to create trade zones for all the potential locations, keeping in mind that we must deliver the order in 15 minutes. This exercise will help us understand the coverage and filter which five locations can cover the most. Dista smart AI/ML-engines uniquely creates a trade zone. The system picks the store location and identifies all the road networks around it. It will then run its patent-pending algorithm to calculate how far we can reach in 15 minutes and create a polygon that can be used as a trade zone for that store. This approach is more practical than making a trade zone circular or hexagonal.
We can analyze each potential location by looking at several geospatial factors within each trade zone using below data points.
- Demography
- Customer segment
- Income groups
- Population
- Age group
- Purchasing patterns
- Ethnic patterns
- Real estate patterns
- (Commercial vs Residential areas)
- Point of Interest data to identify retail stores nearby
Using a location index, we can create a trade zone (grid) around the city. For every trade zone, measure multiple location data streams. Then we can normalize these data to develop a suitability index and rate each trade zone for all the variables. For example, in the above map, the darker trade zone has more attributes for a successful location.
Next, we need to overlay the app’s current signup data or subscribers who signed up and got notifications that we do not deliver to this area.
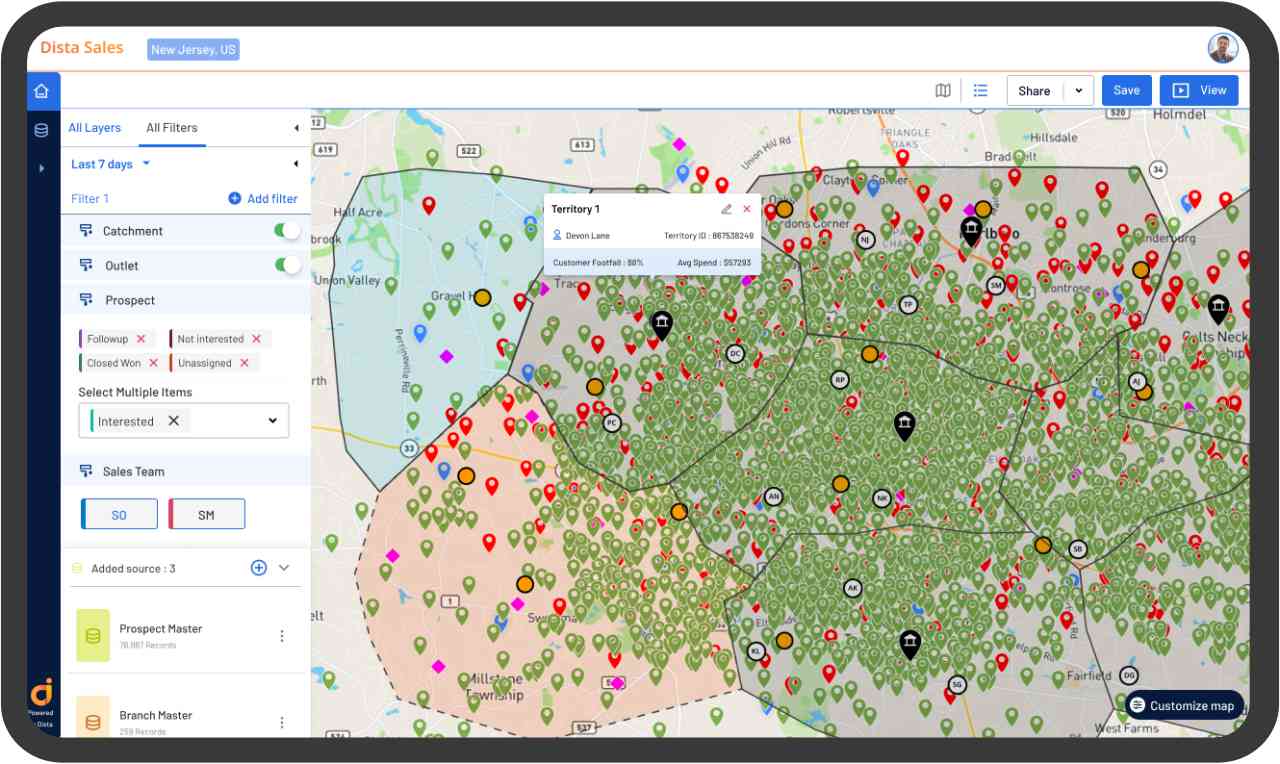
With location analysis and app signup data, we can identify the most preferred locations with maximum coverage. The research will recommend locations and the number of stores that need to be optimized for the operation. The location can be from the original location provided by the field team or a few from the original locations and a few new locations for the field team to explore real estate property.
