Sales Pipeline Metrics to Track at Every Stage

Tracking Sales Pipeline metrics through the lifecycle is just as important as following up on that next important prospect. Relying on intuition alone is not enough in sales. Top-performing teams track sales pipeline metrics and KPIs to see what works, spot where deals stall, and find ways to boost revenue.

A sales pipeline is more than a visual funnel; it is a way to measure progress. Each stage shows a different part of the process, so tracking the right metrics at every step helps improve conversion, speed, and predictability.

Industry benchmarks show that tracking KPIs such as conversion rates, sales cycle length, deal size, and pipeline velocity gives a clear view of pipeline health and helps spot bottlenecks early.

Also read: 6 Key Field Sales KPIs Sales Leaders Should Monitor

Grab the free Sales Pipeline Metrics Template and get instant visibility into your pipeline health, stage by stage.

Download Now

Understanding Sales Pipeline Stages

While pipeline stages and their nomenclature may  vary across industries, a standard B2B sales pipeline typically includes:

  • STAGE 1: Lead Generation
  • STAGE 2: Lead Qualification
  • STAGE 3: Opportunity Creation
  • STAGE 4: Proposal / Negotiation
  • STAGE 5: Closed Won / Lost

Progress that cannot be measured often leads to haphazard efforts. Therefore, the health of each stage of the pipeline needs its own set of metrics, not just overall revenue numbers.

Also Read: What is Lead Management: Meaning, Benefits, and Best Practices 

Stage-Wise Metrics You Must Track

1. Lead Generation Stage (Top of Funnel)

Key Metrics:
  • Number of Leads Generated (Total Leads Generated = Count of new leads in given period)
  • Lead Source Performance (Conversion Rate (Source X) =(Number of Closed-Won Deals from Source X / Total Leads from Source X) × 100)
  • Lead-to-MQL Conversion Rate (Lead-to-MQL Conversion Rate = (Number of MQLs / Total Leads) × 100)
  • Customer Acquisition Cost (CAC) (CAC = Total Sales + Marketing Cost / Number of New Customers Acquired)
Why This Stage Matters:

This stage sets the expectation for the volume and quality of your pipeline. Poor or unmonitored input here can cause problems in later stages.

Most pipeline problems start with poor lead quality or targeting the wrong audience.

Metric Highlight:
  • Lead Conversion Rate = % of leads becoming qualified opportunities

2. Lead Qualification Stage

Key Metrics:
  • MQL to SQL Conversion Rate (MQL-to-SQL Conversion Rate = (Number of SQLs / Number of MQLs) × 100)
  • Lead Qualification Time (Lead Qualification Time = (Date Converted to SQL – Lead Creation Date))
  • Lead Quality Score (Lead Score = (Demographic Score × Weight) + (Behavior Score × Weight) + (Engagement Score × Weight))
Why This Stage Matters:

This stage checks if your pipeline is worth following up on.

A low conversion rate here often indicates:

  • Weak targeting
  • Poor discovery
  • Misaligned ICP
Metric Highlight:
  • Stage Conversion Rate helps identify bottlenecks between stages.

3. Opportunity Stage

Key Metrics:
  • Number of Opportunities Created (Total Opportunities Created = Count of opportunities in given period)
  • Opportunity Win Probability (Win Probability = Historical Win Rate of That Stage)
  • Average Deal Size Total Revenue from Closed-Won Deals / Number of Closed-Won Deals)
  • Pipeline Coverage Ratio (Pipeline Coverage Ratio = Total Pipeline Value / Sales Target (Quota))
Why This Stage Matters:

At this stage, revenue potential becomes real.

Sales leaders use pipeline dashboards to watch deal progress, deal size, and how well their reps are performing.

Metric Highlight:
  • Lead to Opportunity/Deal conversion
  • Lead drop-off rate

4. Proposal / Negotiation Stage

Key Metrics:
  • Proposal-to-Close Conversion Rate (Proposal-to-Close Rate = (Number of Closed-Won Deals / Number of Proposals Sent) × 100)
  • Sales Cycle Length (Sales Cycle Length = (Deal Close Date – Opportunity Creation Date))
  • Deal Velocity (Pipeline Velocity = (Number of Opportunities × Average Deal Size × Win Rate) / Sales Cycle Length)
  • Drop-off Rate (Drop-Off Rate at Stage X = (Number of Deals Lost at Stage X / Total Deals Entering Stage X) × 100)
Why This Stage Matters:

Deals are most at risk in this stage, which directly affects the accuracy of your sales forecasts. 

Metric Highlight:
  • Sales Cycle Length = Time taken to close a deal.
  • Longer sales cycles slow down revenue and make reps less productive.

5. Closed Stage (Won / Lost)

Key Metrics:
  • Win Rate (Win Rate =(Number of Closed-Won Deals / Total Closed Deals) × 100)
  • Revenue Realization (Revenue Realization % = (Actual Revenue Collected / Total Contracted Revenue) × 100)
  • Lost Deal Analysis (by stage) (Lost Deal Ratio = (Number of Closed-Lost Deals / Total Closed Deals) × 100)
  • Customer Lifetime Value (CLV)  (CLV = (Average Revenue per Account × Gross Margin %) /  Churn Rate)
Why This Stage Matters:

This stage shows how effective your sales process is and helps shape future strategy.

Metric Highlight:
  • Win Rate = % of opportunities converted into deals

Cross-Pipeline Metrics (Must Track Across All Stages)

These four metrics apply across all pipeline stages. Track them consistently to get a complete view of pipeline health.

1. Pipeline Velocity

Measures how fast revenue moves through the pipeline

Formula:

(Opportunities × Deal Size × Win Rate) / Sales Cycle

2. Conversion Rate by Stage

Shows how efficiently deals move forward

Critical for identifying funnel leaks

3. Pipeline Coverage

Pipeline value compared to quota makes sure you have enough deals to reach your targets.

4. Activity Metrics
  • Calls, meetings, follow-ups

  • These activities are directly linked to how your pipeline moves forward.

Why Tracking Sales Pipeline Metrics is Non-Negotiable

Sales KPIs are more than reporting tools; they help you make better decisions.

They help organizations:

  • Identify bottlenecks early
  • Improve forecasting accuracy
  • Optimize resource allocation
  • Drive data-backed coaching


If you do not track pipeline metrics, your sales process becomes unclear and results are unpredictable.

How Dista Sales Tracks Pipeline Metrics in Real Time

Platforms like Dista Sales offer a big advantage, especially for companies with field sales, distribution networks, and location-based operations.


1. Real-Time Pipeline Visibility

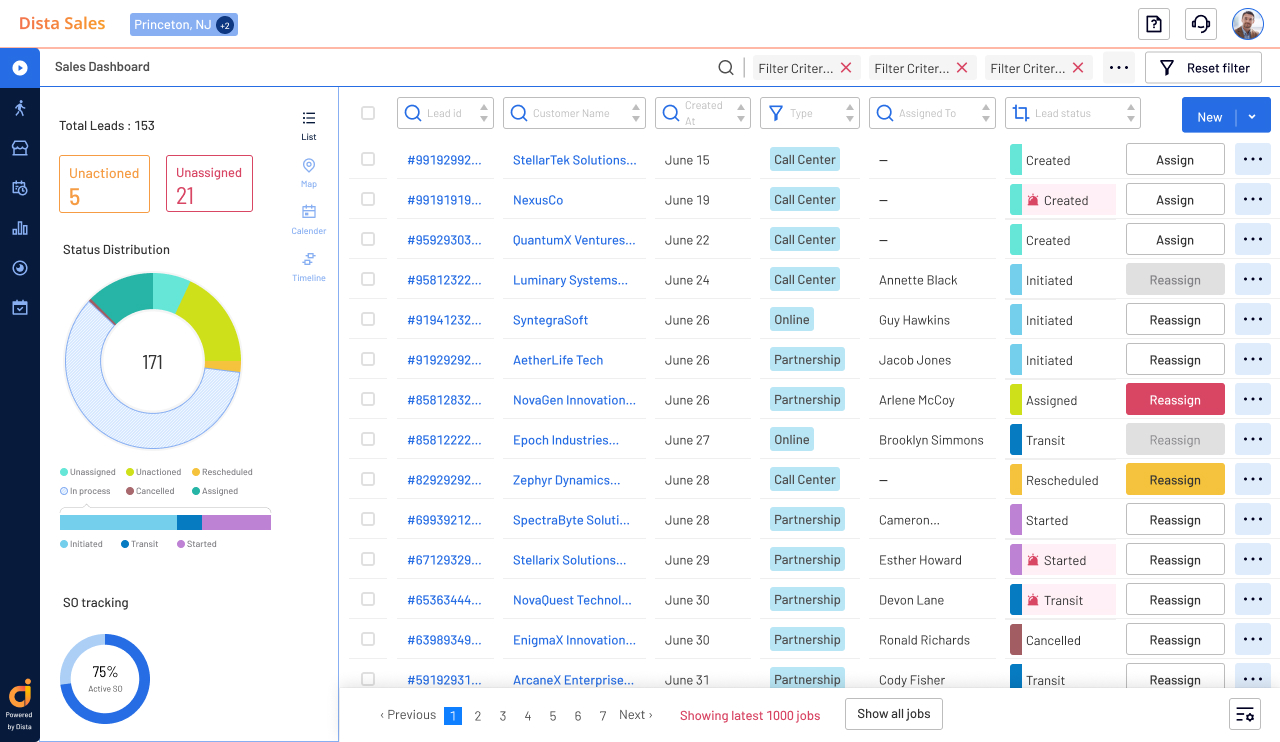
Dista Sales provides:

  • Live pipeline dashboards
  • Stage-wise conversion tracking
  • Territory-level performance insights

Leaders get a detailed view across regions, sales reps, and channels.

2. Geo-Intelligent Lead & Opportunity Tracking

Unlike traditional CRMs, Dista is a location-first platform that allows you to- 

  • Track lead density by geography
  • Measure conversion rates by territory
  • Identify high-performing regions

This is particularly powerful for industries like:

  • BFSI collections
  • FMCG distribution

Also Read: Top 7 Location Intelligence Trends for 2026

3. Activity-to-Outcome Mapping

Dista Sales connects:

  • Field activities (visits, meetings)
  • With pipeline progression

This helps answer:

  • Which activities drive conversions?
  • Which reps are most productive?
4. Sales Funnel Optimization with AI

Using analytics and AI:

  • Predict deal closures
  • Identify stalled deals
  • Recommend next best actions.

This shifts teams from simply tracking deals to actively selling.

5. Territory & Visit Planning Integration

Given your focus on location intelligence GTM, this is critical:

  • Optimize visit frequency
  • Align rep movement with pipeline priorities.
  • Improve conversion through better coverage.

Turn Metrics into Actionable Insights

Tracking sales pipeline metrics is not just about dashboards; it is about having control over your revenue results.

The most successful organizations:

  • Track metrics at every stage, not just at closure
  • Focus on conversion efficiency, not just volume.
  • Use platforms like Dista Sales to unify data, geography, and execution. 

For Example, Dista Sales can be integrated with existing CRMs and data sources through secure APIs and data connectors. The typical integration process involves connecting your current CRM (such as Salesforce or Microsoft Dynamics) to Dista, mapping key fields, and syncing data regularly for consistency. Most setups can be completed in phases, starting with data import and pipeline mapping, followed by enabling live dashboards and territory insights. This allows managers to keep their existing workflows while taking advantage of Dista’s extended capabilities.

In a competitive market, the key to hitting your targets is understanding your pipeline well, not just making it bigger. Get in touch to explore how Dista’s solutions can support your goals.