
It is not always possible to determine the success of your delivery logistics. Companies can evaluate their delivery logistics state by relying on specific key performance indicators (KPIs) to see how each area of your service works. The KPIs also offers a quick look at your business and the efficiency of its delivery operations. The right delivery logistics solution can help you measure and monitor top key metrics like a timely pickup, efficient delivery operation, number of deliveries, and more.
Tracking logistics KPIs helps you take necessary measures by taking a look at the performance of your service. Moreover, it also enables you to identify the strengths and weaknesses of your delivery logistics.
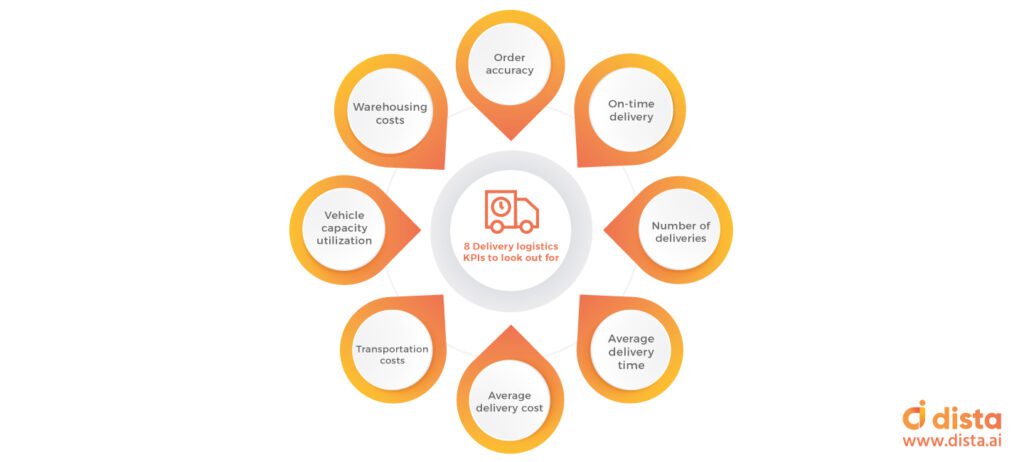
Top KPIs to Measure the Delivery Logistics Performance
Let’s take a look at the essential KPIs you should measure to improve your company’s logistics.
1) Order Accuracy
The order accuracy rate is also a vital logistics metric as it measures the total volume of orders that are shipped and delivered without any errors. It enables managers to identify inaccuracies during the delivery process in the form of failed deliveries, incorrect orders, returned, or damaged goods. You can measure the order accuracy rate by subtracting the error orders from the total orders and dividing them by the total orders.
It is measured during different delivery processes as errors can occur throughout the delivery cycle. A good logistics software helps managers identify errors in delivery as it allows customers to rate and submit feedback about their experience.
2) On-time Delivery
The on-time delivery performance KPI refers to the ratio of orders that have been shipped on or before the shipping date. This metric helps you measure the supply chain quality and performance in a faster way. The time since the customer places an order to the moment till it is ready for the shipment should ideally not be too long as it indicates there could be some loopholes in the process.
3) Number of Deliveries
Although this KPI is obvious, it is the one by which all other metrics are measured. The number of completed deliveries is the total of all deliveries fulfilled in a month, quarter, or year. It is ideal for companies to analyze their profit margins. A right delivery management system will help you in increasing the number of deliveries, reducing overall delivery costs, and more. The metric also helps to calculate the average number of deliveries to identify the growth potential.
4) Average Delivery Time
This refers to the average time per delivery required to complete it over a certain period. It helps to track your supply chain network’s effectiveness and the implementation of planned delivery routes. The average time per delivery metric is calculated by dividing the total delivery time by the time metric (day/week/month/quarter/year).
It is also important to offer precise delivery time for a better customer experience, improve your order picking accuracy rate, and reduce returns. Logistics managers need to compare different averages over equal periods to better the delivery process.
5) Average Delivery Cost
The average cost of delivering products is calculated based on distance, products, and vehicle type. The sum of driver cost, fuel cost, and vehicle cost divided by total distance will give you your average delivery cost based on the distance parameter.
Meanwhile, based on the product or vehicle parameter, the average delivery cost is calculated by the sum of driver cost, fuel cost, and vehicle cost (for a product) divided by the total number of deliveries. Organizations can use these averages to implement changes to the service to reduce their cost without affecting performance output/ like using better vehicles or implementing route optimization software.
6) Transportation Costs
The transportation cost metric measures all costs related to each logistics operation right from order placement to final delivery. It helps to know the average spent on each shipment and send accurate quotations to your customers based on different categories like order processing, administration, inventory carrying, warehouse, and the actual transportation costs.
Read more: How dynamic scheduling software empowers field service and delivery management
7) Vehicle Capacity Utilization
This KPI refers to the capacity of a vehicle that delivers products for its total capacity. It shows the amount of idle space that is unused for order fulfillment. You can divide the available capacity with the total fleet capacity to calculate the vehicle capacity. It is an important last-mile delivery metric that helps in vehicle management.
A high vehicle capacity rate indicates there are inefficiencies in the loading procedure or the need for more effective delivery route planning. Meanwhile, a low vehicle availability rate suggests a lack of sufficient fleet, and it needs to be expanded.
8) Warehousing Costs
The warehousing costs KPI refer to the expenses required to manage goods from the warehouse facilities. It includes equipment costs like ordering, storing, and loading the goods along with labor costs. As the warehouse is a key area of your business, it is essential to regularly measure and review the costs to improve your operations.
Also read: 5 delivery KPIs you cannot afford to miss
Final Thoughts
In addition to improving your logistics performance, KPIs play a crucial role in attracting and retaining customers.
Dista is an AI-enabled location intelligence platform that offers a strong delivery logistics management solution. Would you like to check it out? Contact us here.