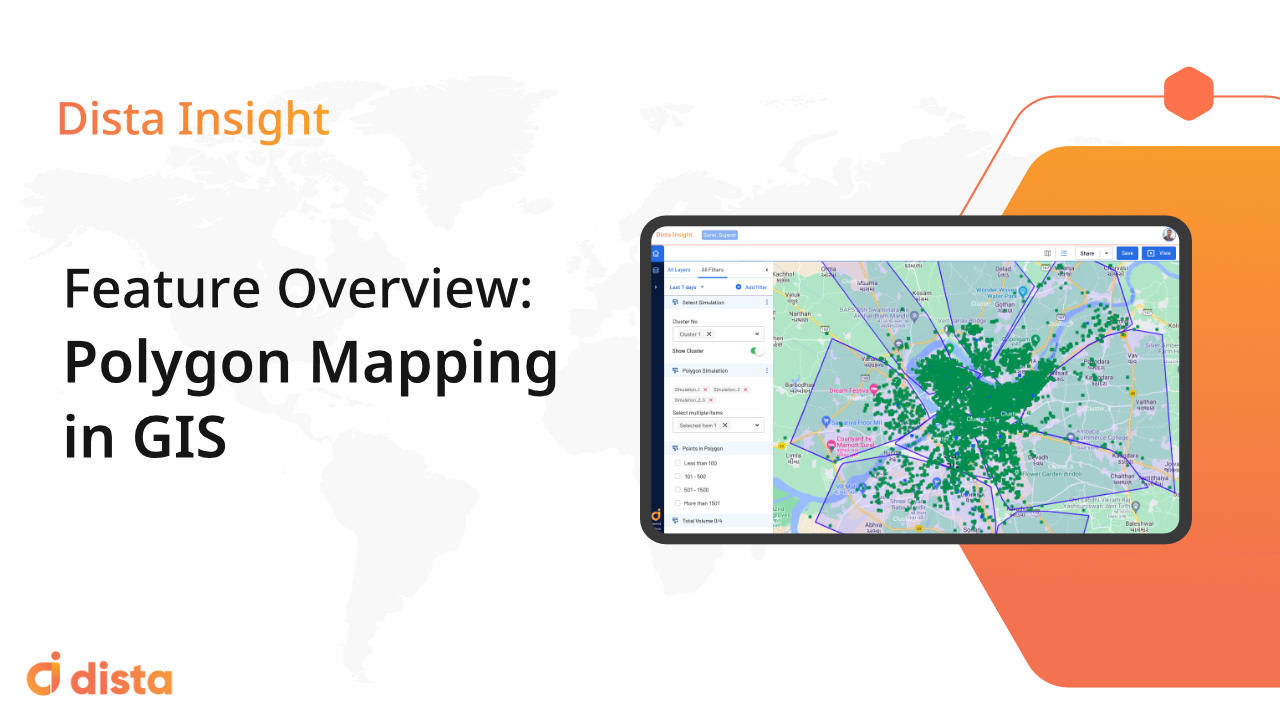
What is a Polygon Mapping in GIS?
In GIS (Geographical Information System), vector data represents the information in three formats – points, lines, and polygons. Polygons are used in GIS to measure the area and perimeter of a particular location. Typically, it represents large areas like the boundary of a state, lake, or forest, zip codes, zones, etc. Polygons on a map are commonly represented with different schemes and patterns for easier identification of data.
Benefits of Creating Polygons
The main aim of creating polygons is to visualize and analyze data points on the map. You need to set predefined business rules in your system along with the location points and analyze the polygon. This enables businesses to perform gap analysis and make strategic decisions.
How Can You Create and Analyze Data Points Using Polygons?
You can add multiple polygons to a layer, and each polygon can consist of a different set of business rules. A layer consists of a large data set that can have different parameters like latitude, longitude, address, images, etc.
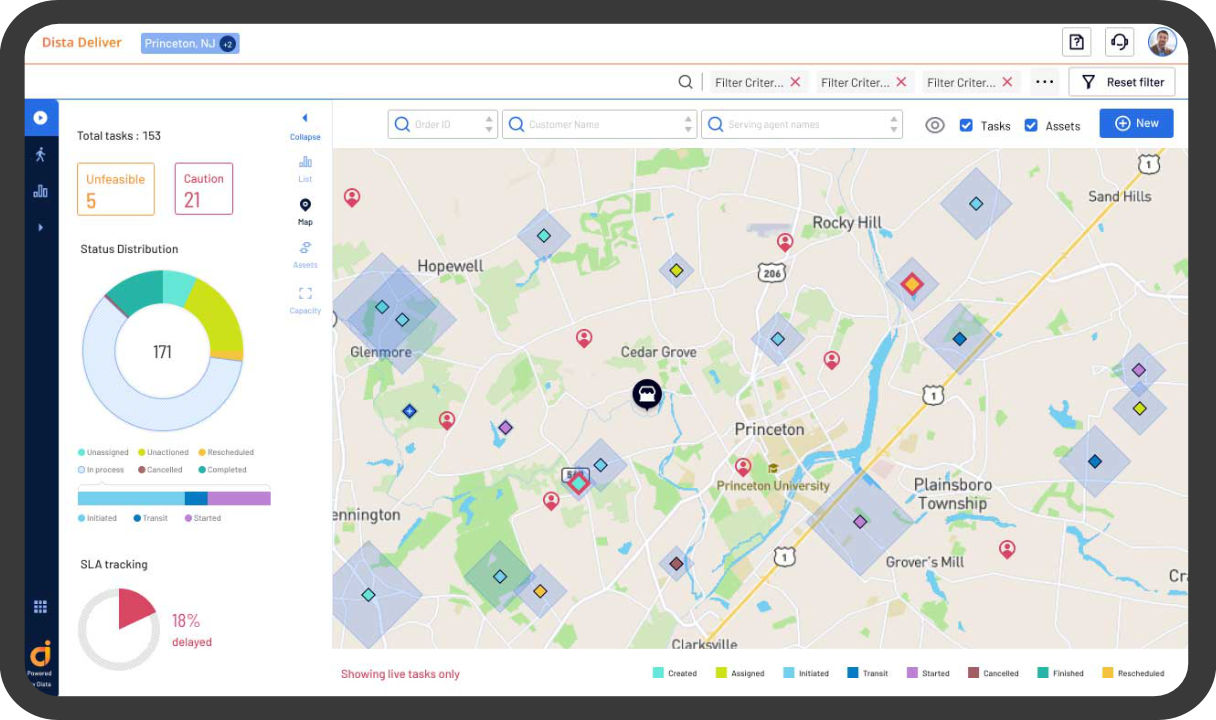
You can manually create and edit polygons. Additionally, you can freeze the most appropriate cluster into polygons. This way, you can superimpose multiple clusters and polygons for deeper data set analysis. Polygons can be styled by count, color, density, and so on. Clicking on them will surface detailed information about its data. You can download data against polygons. Our system lets you surface relevant information using filters for different data layers like areas with high, low, medium density, and so on.
With Dista Insight You Can
- Create and view polygons based on clustering rules
- Create polygons based on outer points of the cluster
- Define, color, and name the polygons
- Configure data and view pop-up for a polygon
- Create a grid for a location by defining the size of the cell
- Modify polygons and its attribute based on the superimposed grid view
- Save and share the analysis
Geospatial Polygon-based Use Cases
- Real estate: Identify houses, commercial properties, or offices in a specific area.
- Insurance risk assessment: Number of claims originated from a particular region.
- Credit risk assessment: Analyze the behavior of credit card accounts to help assess the credit risk level.
- Visit assessment: Analyze footfall to a retail store or food outlet. Using mobile data and leveraging contextual location information can see how consumers move throughout the day. When combined with polygons, mobility data shows which places people visit and how long they stay there.
- Natural disasters: High, medium, and low affected areas for (fire, floods, earthquake, etc.)
- Retail: Store expansion to areas with high demand.
- Financial services: Branch expansion depending on the footfall. Best location selection for ATMs.
Also read – What is geospatial analysis?
Common Use Cases for Multiple Industries
Dista Insight leverages AI and ML engines to perform a comprehensive analysis for businesses that helps them make key strategic business decisions.
- Cost optimization: Analyze costs based on customized business rules and clusters
- Resource planning: Manage staffing for banks, restaurants, delivery personnel for e-commerce and quick commerce businesses, and more.
- Setting up new stores: Opening a new branch, retail store, restaurant outlet, warehouse, distribution hub, and so on.
Contact us to get meaningful insights for your business.